Summary
A pay per click report isn't just a spreadsheet full of numbers. Think of it as the story of your ad spend—a narrative that tells you exactly what worked, what flopped, and where your money made the biggest impact. Are you ready to listen to what your data is saying?
Unlocking Your PPC Campaign's True Story

So, you're running PPC campaigns. You’re investing in ads, but are you truly confident about what’s happening on the other side? It's a common challenge. Businesses pour resources into platforms like Google Ads but struggle to connect the dots. Are your ads actually hitting the mark? Are those clicks turning into real, paying customers?
Flying blind is a recipe for wasted ad spend. Without a clear, insightful report, you're just guessing.
This guide is here to change that. We’ll demystify the entire process, helping you transform complex data into a clear story about your campaign's performance. It’s time to move beyond surface-level metrics and see how a solid PPC report can become your roadmap to smarter, more profitable advertising.
Why Your PPC Report Matters More Than You Think
A great report is much more than a simple numbers tracker; it's the tool you use to make intelligent marketing decisions. It acts as the bridge between your advertising budget and your business goals, answering the one question that really matters: "Am I getting a good return on my investment?"
Honestly, getting a handle on your reporting is non-negotiable. Here’s why:
- It Reveals Your Winners: A good report instantly flags which campaigns, ad groups, and keywords are driving the most conversions. This lets you double down on what’s already working.
- It Pinpoints Wasted Spend: It shines a bright light on underperformers draining your budget, so you can stop the bleeding and reallocate that money effectively.
- It Fuels Future Strategy: By analyzing historical data, you start to see trends. This allows you to make data-driven predictions and build future campaigns that are optimized from day one.
- It Justifies Your Budget: Nothing speaks louder than results. A clear report showing a strong ROI is your best tool for justifying ad spend to stakeholders or securing a larger budget.
A pay per click report isn't just a record of past performance; it's a strategic tool that illuminates the path to future growth and higher profitability.
Ultimately, mastering your report transforms you from someone who just spends money on ads into an active strategist. It empowers you to refine your targeting, sharpen your ad copy, and optimize your landing pages based on what your audience is actually telling you with their clicks.
Moving Beyond Simple Metrics
Forget getting bogged down by vanity metrics like impressions and clicks. While they have a place, they don't tell the whole story.
Instead, this guide will help you zero in on the numbers that directly impact your bottom line, like Cost Per Acquisition (CPA) and Return on Ad Spend (ROAS). You’ll learn how to connect the dots between the number of people who see your ad and how many of them actually become loyal customers.
Ready to find out what your campaigns are really telling you? Let's dive in and turn that raw data into a serious competitive advantage.
What Is a Pay Per Click Report Anyway?
Before diving into the nitty-gritty, what exactly is a pay per click report? Forget the intimidating spreadsheets and complex dashboards for a moment. At its core, a PPC report is simply a health check for your paid advertising campaigns.
Think of it like a financial statement for your ads. Just as a P&L statement reveals your company's financial health, a PPC report shows how your ads are performing on platforms like Google Ads or Meta. It’s the story of your ad spend, told through data.
Grasping this fundamental concept is crucial for everyone, from the marketing specialist deep in the details to the executive who needs a high-level summary. It helps your entire team ask the right questions and guide strategy with real insights, not just gut feelings.
More Than Just a Data Dump
A common mistake is treating PPC reports as a simple data dump—a pile of numbers without context. A great report, however, is a strategic tool built to bring clarity and provide direction. It's not just about what happened; it's about why it happened and what you should do next.
A well-crafted report should answer key questions about your campaigns:
- Is our money being spent wisely? It tracks every dollar and ties it directly to actions like clicks and conversions.
- Are we reaching the right audience? Metrics like click-through rate (CTR) indicate if your ads are resonating with your target users.
- Are our ads genuinely helping the business? This is the bottom line. The report must link ad performance to tangible business goals like leads, sales, or sign-ups.
This visual breaks the report down into its three main pillars: tracking your investment (Ad Spend), measuring engagement (Clicks), and seeing the results (Conversions).
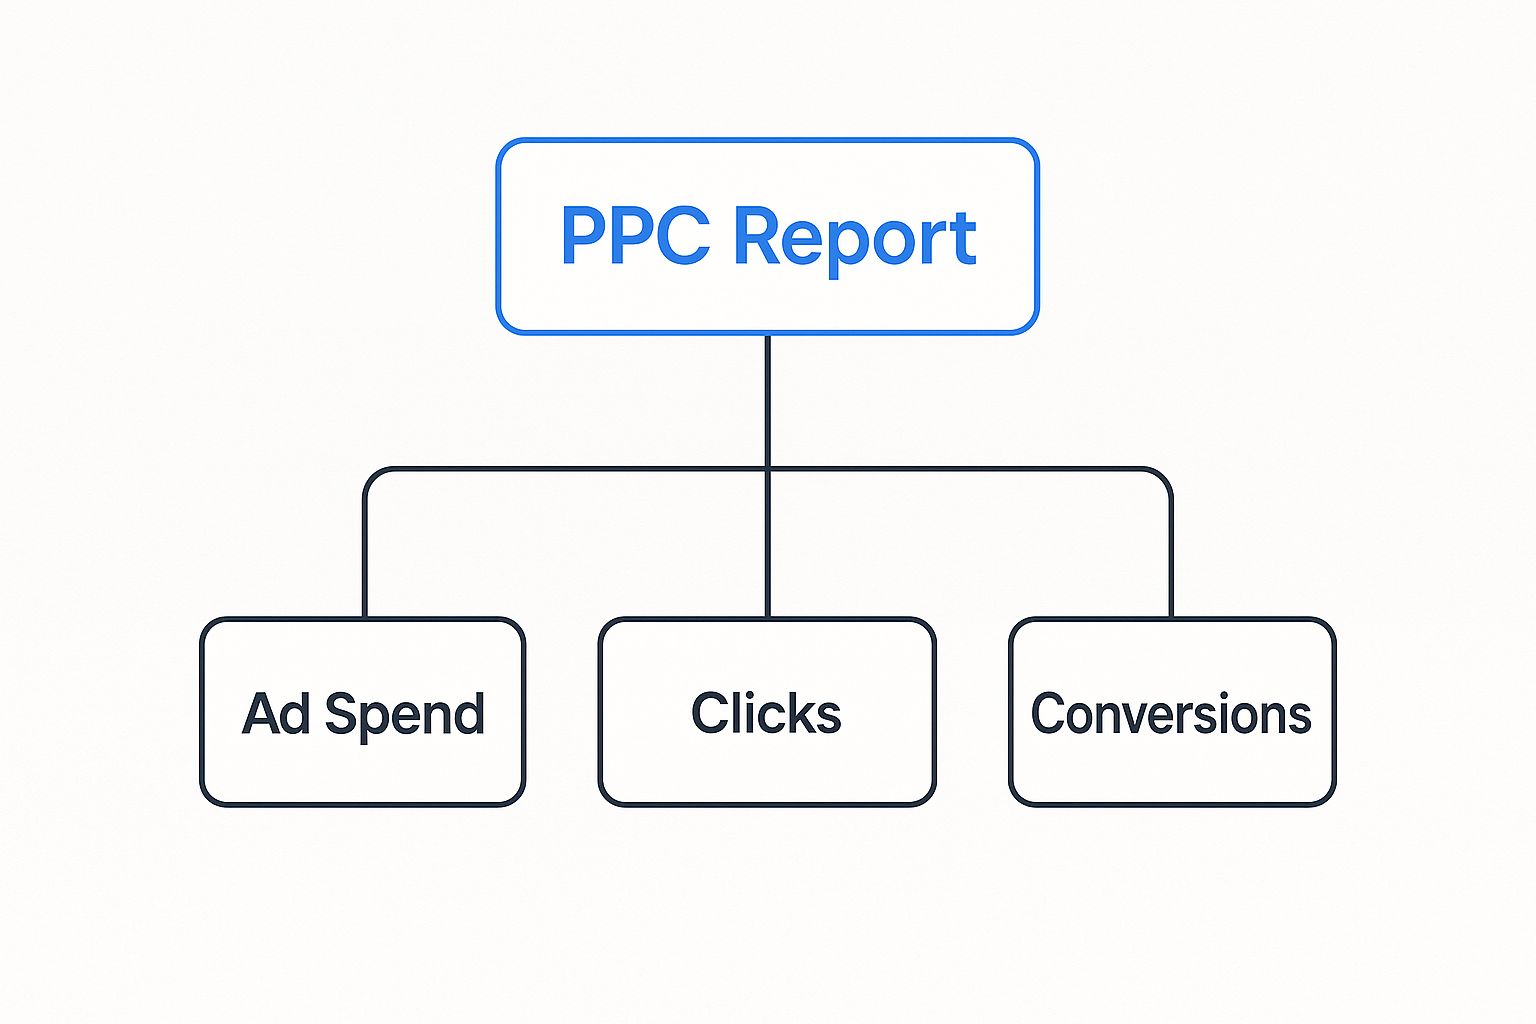
When you see these three components together, it’s clear how a good report tells a complete story, from the initial cost to a measurable win.
Why This Matters in Today's Market
Clear reporting has become more critical as the industry has grown. PPC advertising is now a massive piece of the marketing puzzle. In the U.S. alone, paid search spending is expected to hit $124.59 billion in 2024, an 11.1% jump from last year. You can find more PPC spending trends on Backlinko.com.
That level of investment demands accountability. You need to know what you're getting for your money, and that’s precisely what a good report delivers.
A pay per click report translates raw campaign data into a clear narrative of performance, highlighting opportunities for optimization and justifying every dollar of your ad budget.
With so much on the line, guessing isn't an option. A solid report gives you the proof needed to justify your budget and invest more in the campaigns that are actually working. It’s the difference between blindly spending money and making smart, strategic investments.
So, are your current reports telling you the whole story? If not, it’s time to rethink your approach and start creating reports that drive action. When you master your reporting, you turn data from a confusing mess into your most powerful tool for growth.
Decoding the Essential PPC Report Metrics
This is where the story of your campaign truly unfolds. A pay per click report is more than just numbers; it's a narrative. Each metric is a character, and your job is to listen to what they're saying together.
Let’s pull back the curtain on the non-negotiable metrics that every solid report needs. We won't just define them—we'll explore why they matter to your bottom line. It all starts with a genuine Understanding Key Performance Indicators and how they connect to your business goals.
Visibility and Engagement Metrics
Before you can dream of conversions, you need eyeballs. These first metrics tell you if your ads are being seen and, more importantly, if anyone cares. Think of this as the top of your funnel, where first impressions are everything.
Ready to see how these metrics work together? Let's look at the key players in a typical PPC report.
Here’s a quick-reference table to keep them straight. We'll break down the essentials: what they measure and why they are critical for determining if your campaigns are working.
This table is your cheat sheet, but the real magic happens when you understand the story these metrics tell together. Let's dig deeper into each one.
The Top of the Funnel: What People See
Impressions
This is the simplest metric. An impression is counted every time your ad appears on a search results page or another website. It’s a raw measure of visibility.
But impressions alone don’t mean much. Think of it like a billboard on a highway—thousands of people might drive past, but that tells you nothing about who actually read the sign. It’s just the starting point.
Clicks
Now we're talking. A click happens when someone was interested enough in your ad to take action. This is a much stronger signal than an impression, indicating that your ad creative and targeting are beginning to work.
An impression means your ad was seen; a click means your message resonated. The goal is to turn those views into active engagement.
Click-Through Rate (CTR)
Here’s where it gets interesting. Your Click-Through Rate (CTR) is the percentage of people who saw your ad (impressions) and clicked it. Simply divide your clicks by your impressions to find your CTR.
This metric is a direct reflection of your ad's relevance. A high CTR is a great sign—it tells you that your ad copy and keywords align with what people are searching for. A low CTR, on the other hand, is a major red flag that something is off.
The Bottom Line: Cost and Efficiency
Okay, so people are clicking. But what is it costing you? These metrics are all about financial efficiency. You need to ensure you're getting the most bang for your buck.
- Cost Per Click (CPC): This is straightforward—it's the average price you pay each time someone clicks your ad. It's a critical number for managing your budget.
- Managing CPC: A lower CPC means your budget can stretch further to get more clicks. But be careful. The cheapest clicks aren't always the best. The goal is to find the sweet spot between low cost and high-quality traffic.
- Ad Rank and Quality Score: Platforms like Google Ads reward relevant ads. A high Quality Score can actually lower your CPC. If you want to dive deeper, our guide explains how to improve Quality Score and get more for your money.
The Payoff: Performance and Profitability
At the end of the day, PPC is about one thing: results. These final metrics tie everything back to what truly matters for your business. They answer the million-dollar question: "Are we actually making money from this?"
Conversions
A conversion is the specific action you want someone to take after clicking your ad. This is the "win" you're aiming for. It's unique to your business, but it could be anything from:
- Making a purchase
- Filling out a contact form
- Signing up for a newsletter
- Downloading a guide
Tracking conversions is not optional. It’s the only way to know if your campaigns are genuinely successful.
Cost Per Acquisition (CPA)
Also known as Cost Per Conversion, your CPA is the average cost to get one new customer or lead. You calculate it by dividing your total campaign cost by your total number of conversions.
This is arguably the most important metric on this list. It tells you precisely how much you have to spend to achieve your main goal. A campaign is only truly successful when your CPA is comfortably lower than the value that new customer brings to your business.
Structuring Your Report for Maximum Impact

Let's be honest: raw data is just noise. A truly effective pay per click report isn't about dumping every possible metric onto a page. It’s about telling a compelling story. Without the right structure, crucial insights get buried, and no one can see what's actually working.
How you build your report is the difference between it getting read and acted on versus being filed away and forgotten. A logical flow guides your audience from the big-picture summary to the granular details, making the key takeaways impossible to ignore.
Think of it like building a pyramid. You place the most important point at the top, then you build a solid foundation of data underneath to support it. This structure ensures the report is valuable for everyone, from the CEO with 60 seconds to spare to the marketing specialist needing to dive into campaign specifics.
Start with the Executive Summary
Every report should kick off with an executive summary. This is, without a doubt, the most critical part of the document, especially for clients or leadership who aren't in the PPC trenches daily. It’s your one shot to get the bottom line across immediately.
Keep it short, clear, and in plain English. Ditch the jargon and focus on the numbers that tie directly to business goals.
So, what should you include?
- Overall Performance: A quick line on how campaigns performed against their main goals. Did you hit the conversion target?
- Total Ad Spend vs. Return: Clearly state the total spend and the revenue or value it generated, highlighting the Return on Ad Spend (ROAS).
- Key Wins and Challenges: Point out one or two major wins and any significant hurdles you encountered.
- Top-Line Recommendation: Based on the data, what is the single most important action you recommend next?
This section sets the stage and gives time-crunched stakeholders everything they need in a single snapshot.
Break Down Performance by Campaign
Once you've provided the 30,000-foot view, it's time to zoom in. This is where you get into the details, breaking down performance by individual campaigns, ad groups, and even top-performing keywords. You're providing the evidence to back up the claims from your executive summary.
Organizing this data is key. Grouping by campaign allows you to tell a mini-story about each initiative. For a lead generation campaign, you’ll want to highlight the Cost Per Acquisition (CPA). For an e-commerce campaign, it’s all about ROAS and conversion value.
Presenting this information in a simple table or using clear headings makes it much easier to follow.
Your goal is to create a clear narrative that guides the reader through the data, connecting high-level outcomes to the specific actions and results at the campaign level.
For instance, you could show how one ad group drove 65% of all conversions for half the average cost. That immediately flags it as a winner deserving more budget. This level of detail is invaluable for the marketing team members running the campaigns daily. It’s their roadmap for what to do next.
Visualize Your Data with Charts and Graphs
People are visual creatures. A dense spreadsheet can be intimidating, but a simple line graph showing a trend is understood instantly. Data visualization isn't just a nice-to-have; it's a must for an effective pay per click report.
Use visuals to make your key points pop.
- Line Charts: Perfect for showing trends over time, like daily clicks, impressions, or conversions.
- Bar Graphs: Great for comparing performance between different campaigns, ad groups, or devices.
- Pie Charts: Use these to show splits, like the percentage of conversions from mobile versus desktop.
Visuals break up the wall of text and numbers, making your report more engaging and digestible. A well-placed chart can convey a point more powerfully than a paragraph, ensuring your most important findings aren't missed.
Conclude with Actionable Recommendations
Finally, every report must answer the big question: "So what?" This is where you turn insights into a concrete action plan. Without this section, your report is just a history lesson. With it, your report becomes a strategic tool for driving future success.
Your recommendations must be specific, measurable, and tied directly to the data you've presented.
Instead of a vague suggestion like "improve underperforming campaigns," get specific:
- "Reallocate 15% of the budget from Campaign B to Campaign A, which has a 50% lower CPA."
- "Pause the 'Generic Keywords' ad group and test three new long-tail keyword variations to improve CTR."
- "A/B test new ad copy for the 'Summer Sale' campaign to increase its current CTR of 2.1%."
This final step transforms your pay per click report from a passive summary into an active driver of strategy. It proves the value of your work and shows you know exactly what to do next.
Advanced Metrics for Deeper Campaign Insights
Once you've mastered the basics, it's time to dig deeper. This is where you move beyond tracking clicks and start connecting your ad spend to tangible business results. It’s what separates a standard pay per click report from one that drives strategy.
These advanced numbers tell you not just if your campaigns are working, but how well they’re fueling the bottom line. They answer the questions that really matter: Are we profitable? How much of the market are we capturing? Are we acquiring customers who will stick around?
From Cost to Profitability with ROAS
The first stop on our tour of advanced metrics is Return on Ad Spend (ROAS). While CPA tells you what it costs to get a customer, ROAS shows you how much revenue you generated for every dollar spent on ads. It's the ultimate measure of campaign profitability.
The formula is refreshingly simple: (Total Revenue from Ads / Total Ad Cost).
A ROAS of 4:1, for example, means you're generating $4 in revenue for every $1 you invest in your campaigns. For e-commerce or any business that can directly attribute sales to ads, this metric is an absolute game-changer. It shifts the conversation from "How much did we spend?" to "How much did we earn?"
Want to get into the weeds on this? We have a full guide on how to calculate Return on Ad Spend that breaks it all down.
Winning the Ad Auction with Quality Score
If you're running ads on Google, Quality Score is a metric you cannot afford to ignore. It’s a diagnostic rating from 1 to 10 that Google assigns to your ads, keywords, and landing pages. Think of it as Google's way of rating how relevant and helpful your ad experience is to a user.
So, why is a high Quality Score such a big deal?
- You pay less. Google literally rewards high-quality ads with a lower Cost Per Click (CPC).
- You rank higher. You can secure better ad positions without having to outbid everyone.
- You get seen more. Better scores mean your ads are eligible to appear in more auctions.
Think of Quality Score as your reputation in the Google Ads auction. A great reputation gets you preferential treatment, making your budget stretch further and putting your ads in front of more people.
Boosting your Quality Score comes down to creating a seamless user experience. Your keywords, ad copy, and landing page must be perfectly aligned with what the user is looking for. It's a direct lever you can pull to make your campaigns more efficient.
Understanding Your Market Footprint with Impression Share
Ever wonder if you're capturing all possible traffic for your target keywords? Impression Share (IS) provides the answer. It’s the percentage of impressions your ads received compared to the total number of impressions they could have received.
Let's say your Impression Share is 70%. This means your ads are showing up in 7 out of every 10 eligible searches. That other 30% is a missed opportunity, likely because your budget was exhausted or your ad rank wasn't high enough. This metric is critical for gauging your visibility against the competition.
The PPC market is exploding, with search ad spending projected to hit $351.5 billion by 2025. In such a competitive space, knowing your Impression Share helps you decide whether to increase your campaign budget or focus on improving your ad rank to grab a bigger piece of the pie. It's no surprise that businesses typically earn $2 for every $1 spent—it's a powerful channel when you know how to dominate it.
Measuring Long-Term Success with Customer Lifetime Value
Finally, for any business focused on long-term growth, Customer Lifetime Value (CLV) is a powerhouse metric for your pay per click report. CLV estimates the total revenue you can expect from a single customer over your entire relationship.
When you connect CLV to your PPC campaigns, your strategy becomes much smarter. You might discover that a campaign with a higher initial CPA is actually your most profitable one because it attracts customers with a massive CLV. This insight allows you to make smarter bidding decisions, shifting your focus from just the first sale to acquiring the right customers who will deliver value for years.
Turning Your Data Into Actionable Strategy
A pay per click report is much more than a document recapping what already happened. It's your strategic playbook for what comes next. The real goal isn't just to look at numbers; it's to use that information to make smart, profitable decisions that give you a competitive edge.
This entire process boils down to connecting an insight to a concrete action. For example, if your report flags a keyword group that's performing exceptionally well but has a low impression share, the next move is clear: allocate more budget to it. Conversely, if a campaign is bleeding money with a high CPA, that's your cue to investigate if the targeting is off or the ad creative has gone stale.
But your data doesn't exist in a vacuum. To truly understand what's happening, you must see how you stack up against the competition. Placing your report's numbers in the context of a thorough competitive landscape analysis is non-negotiable. It helps you spot market gaps and see potential threats before they become major problems.
Your Checklist for an Effective Report
Ready to stop reporting and start doing? Here’s a quick checklist to ensure your next report leads to meaningful change:
- Start with a clear summary: Don't bury the lead. Put the biggest wins, losses, and top recommendations right at the beginning for stakeholders short on time.
- Focus on business goals: Always tie metrics like CPA and ROAS back to what the business actually cares about—revenue, growth, and the bottom line.
- Segment your data: The real gold is often hidden in the details. Break down performance by campaign, device, or demographic to uncover game-changing insights.
- Assign clear action items: Every insight should be paired with a next step. Who is responsible? When is it due? Eliminate all ambiguity.
By following this structure, you build a powerful feedback loop. Each pay per click report doesn't just close out the month; it makes the next campaign smarter, sharper, and more efficient.
The most valuable reports are not those that simply present data, but those that inspire decisive action and continuous improvement.
It's time to stop letting your reports collect digital dust. Take a hard look at your current process and use this framework to start optimizing your campaigns for real results. For a deeper look at the specific numbers you should be tracking, check out our complete guide to advertising performance metrics.
Common Questions About PPC Reports (Answered)
Even after you've mastered the metrics and a solid report structure, a few practical questions often arise. Think of this as the "what they don't always tell you" section—just straightforward answers to common hurdles people face when building and sharing PPC reports.
Let's clear up a few things that can make or break the effectiveness of your reporting.
How Often Should I Run a PPC Report?
There's no single magic number. The right reporting frequency depends on the pace of your campaigns and your audience. What works for your internal team won't work for a C-suite executive.
Here’s a simple framework that works well:
- Weekly Reports: These are your internal pulse checks. They're perfect for the marketing team to stay on top of performance, catch issues early, and make quick tweaks to bids and budgets. It's all about agility.
- Monthly Reports: This is the sweet spot for most clients and leadership teams. A month provides enough data to spot real trends and show meaningful progress without getting lost in daily fluctuations.
- Quarterly Reports: It's time to zoom out. Quarterly reports are for big-picture strategic conversations. You'll look at performance against long-term goals and make major decisions about where to invest next quarter.
The most important thing? Be consistent. Pick a schedule and stick to it to create a rhythm of accountability and keep everyone aligned.
What Are the Best Tools for PPC Reporting?
If you're still pulling data from multiple platforms by hand, you're setting yourself up for headaches. Using the right tools is a game-changer for building an accurate pay per click report without burning hours of your time. While platforms like Google Ads have native reporting, dedicated tools offer much more power.
The best reporting tools don't just spit out numbers; they help you tell the story behind them. They should connect all your data sources, automate the grunt work, and make your insights easy for anyone to understand.
When shopping for tools, look for ones that can pull from all your ad channels—like Google Ads, Meta, and LinkedIn—plus your analytics platform.
Specifically, you want features like:
- Automated Data Consolidation: It should pull all your key metrics into one dashboard automatically. No more copy-pasting.
- Customizable Dashboards: You need the ability to build different views for different audiences.
- Scheduled Delivery: Set it and forget it. Have reports automatically sent to stakeholders on a schedule you choose.
These tools free you up to do what you're actually paid for: thinking, analyzing, and strategizing—not being a data entry clerk.
How Do I Explain PPC Results to Non-Marketers?
Talking PPC with someone who doesn't live and breathe this stuff can feel like speaking a different language. The key is to stop talking about marketing metrics and start talking about business results.
So, instead of saying, "Our CTR jumped to 3.5% and our Quality Score is a solid 8/10," frame it in a way that connects to what they truly care about: money.
Try this instead: "We invested $5,000 in ads last month, which brought in 50 qualified leads for the sales team. That works out to a cost of $100 for each new lead, putting us 20% under our target."
See the difference? This simple story translates your hard work into the language of cost and return. It’s a narrative every stakeholder can understand and support. Always lead with the "so what?"—the real-world impact your campaigns are having on the business.
Ready to transform your post-click experience and ensure every ad dollar counts? LanderMagic helps you create dynamic, high-converting landing pages that are perfectly optimized for your Google Ads campaigns. Stop losing leads to slow, generic pages and start seeing a real return on your investment.
Create your first high-converting landing page with LanderMagic today!