Summary
meta_description: Learn how to measure marketing campaign success with our expert guide. Define key KPIs, track data, and turn insights into actionable strategies for higher ROI.
Measuring marketing campaign success boils down to one critical skill: turning data into smarter decisions. It’s about drawing a clear line from every tweet, email, and ad you run to a tangible business outcome—whether that’s generating leads, closing sales, or boosting customer loyalty. This is how you prove your marketing drives real growth.
Are you ready to stop guessing and start measuring what truly matters?
Why Measuring Your Marketing Success Is Non-Negotiable

Let's be honest. Launching a campaign without a solid measurement plan is like driving blindfolded. You're moving, but are you heading toward your goal or straight off a cliff?
Knowing how to measure your marketing effectively separates pure guesswork from actual strategy. It gives you the clarity to justify your budget, prove your value, and make confident, data-backed decisions.
But this isn't just about a report you pull at the end. Think of it as a live feedback loop. By monitoring performance during the campaign, you can make agile tweaks. An ad not hitting the mark? Change the copy. A social channel delivering amazing results? It's time to double down.
The goal of measurement isn't just to prove your work was successful; it's to make your next campaign even more successful. Data-driven insights are your roadmap to repeatable wins and sustainable growth.
This approach transforms marketing from a "cost center" into a powerful revenue engine. You get to see exactly what resonates with your audience and what falls flat.
What are the core benefits of a strong measurement framework?
Putting a solid measurement plan in place delivers both immediate wins and long-term advantages. Suddenly, you'll be able to:
- Justify Marketing Spend: Armed with clear data on Return on Investment (ROI) and Customer Acquisition Cost (CAC), you can show executives exactly how every dollar contributes to the bottom line.
- Optimize Future Campaigns: Lessons from one campaign directly inform the next. You'll stop repeating mistakes and start scaling what works, making your strategy smarter each time.
- Improve Audience Targeting: Your data illuminates which audience segments respond best. This allows you to fine-tune your targeting and messaging for maximum impact.
- Enhance Team Alignment: When everyone on the team understands the key metrics and goals, you all row in the same direction. The result? A more cohesive and effective effort.
Ultimately, effective measurement empowers you to operate with confidence. Ready to build that framework?
Setting the Right KPIs for Your Campaign Goals

Here’s a crucial truth about measurement: it starts long before you look at a report. The real work begins when you define what "success" actually means for your campaign.
Are you trying to blast your brand name across the internet? Or is the goal to generate a steady stream of qualified leads for your sales team? Perhaps it's all about driving direct online sales, right now.
Each of these goals lives in a different part of the marketing funnel. Trying to measure them with the same yardstick is a recipe for confusion. You wouldn't judge a brand awareness campaign solely on sales, just as you wouldn't measure a direct sales campaign by social media likes.
The secret is to match your metrics to your mission. This simple alignment ensures every action you take pushes you toward your true business objectives.
How do you match metrics to the marketing funnel stage?
I find it helpful to think of the marketing funnel in three core stages: top, middle, and bottom. Each has a different job, which means it needs its own set of KPIs.
- Top of Funnel (Awareness): This is your first handshake. The goal is to introduce your brand to new audiences. Here, we focus on reach and visibility, not immediate sales.
- Middle of Funnel (Consideration): Now you're building a relationship. You've captured their attention, and you want to see signs of genuine engagement as they evaluate their options.
- Bottom of Funnel (Conversion): This is where the action happens. We’re turning interested prospects into paying customers. These metrics are all about revenue and business growth.
When you organize your KPIs this way, you create a clear roadmap for measuring success at every touchpoint. You'll know exactly which levers to pull to improve performance. For a deeper look, check out our guide on choosing the right KPI for a website to ensure your digital hub is firing on all cylinders.
What are the best top-of-funnel visibility metrics?
When brand awareness is the name of the game, your KPIs must show how many eyeballs are seeing your content. Metrics like impressions, reach, and search engine rankings are your bread and butter.
Impressions tell you how often your content was displayed, while reach tells you how many unique people saw it. Strong search rankings are also critical, as they directly fuel organic traffic. Mastering these numbers helps you fine-tune your targeting and maximize your brand's exposure.
Success at the top of the funnel isn't about making a sale today. It's about earning a spot in your customer's mind so they think of you when they're ready to buy tomorrow.
What financial metrics matter at the bottom of the funnel?
As prospects move down the funnel, your focus shifts from visibility to profitability. This is where financial metrics take center stage.
There are a few critical KPIs to track here:
- Customer Acquisition Cost (CAC): How much does it cost to acquire a new customer? Calculate this by dividing your total campaign spend by the number of new customers you gained.
- Return on Investment (ROI): This is the ultimate measure of profitability. It shows how much revenue you generated for every dollar spent.
- Conversion Rate: What percentage of people took the action you wanted? Whether it’s a purchase or a form submission, this number is crucial.
These bottom-funnel metrics provide the hard data you need to prove marketing's value and justify your budget. They draw a straight line from your efforts to the company's bottom line.
How to Collect and Organize Your Campaign Data
Great campaign insights are built on clean, reliable data. But with so many channels, gathering the numbers can feel overwhelming. The secret isn't just to pull data; it's to build a system that brings everything together into one coherent story.
The process starts by identifying your primary data sources. For most marketers, this means tapping into the native analytics of each platform. Think Google Analytics for website traffic, Google Ads for PPC performance, and the built-in dashboards of platforms like Meta, LinkedIn, or TikTok for social media metrics.
Each tool provides a granular view of its channel. The real challenge is piecing that scattered data together to see the big picture.
How can you build a unified view of your campaign?
To truly understand performance, you must break down data silos. Instead of jumping between a dozen tabs, your goal should be to pull all key metrics into a central dashboard. This doesn't have to be complex—a well-organized Google Sheet or a tool like Google Data Studio (now Looker Studio) can work wonders.
This central hub should automate as much reporting as possible. Connecting your data sources ensures your metrics are always up-to-date and accurate, ready for analysis without tedious manual work.
A great measurement system isn't about collecting every possible data point. It's about collecting the right data points and making them easy to understand at a glance.
This infographic clearly compares top-of-funnel metrics (like impressions and clicks) against the one that truly matters: conversions.
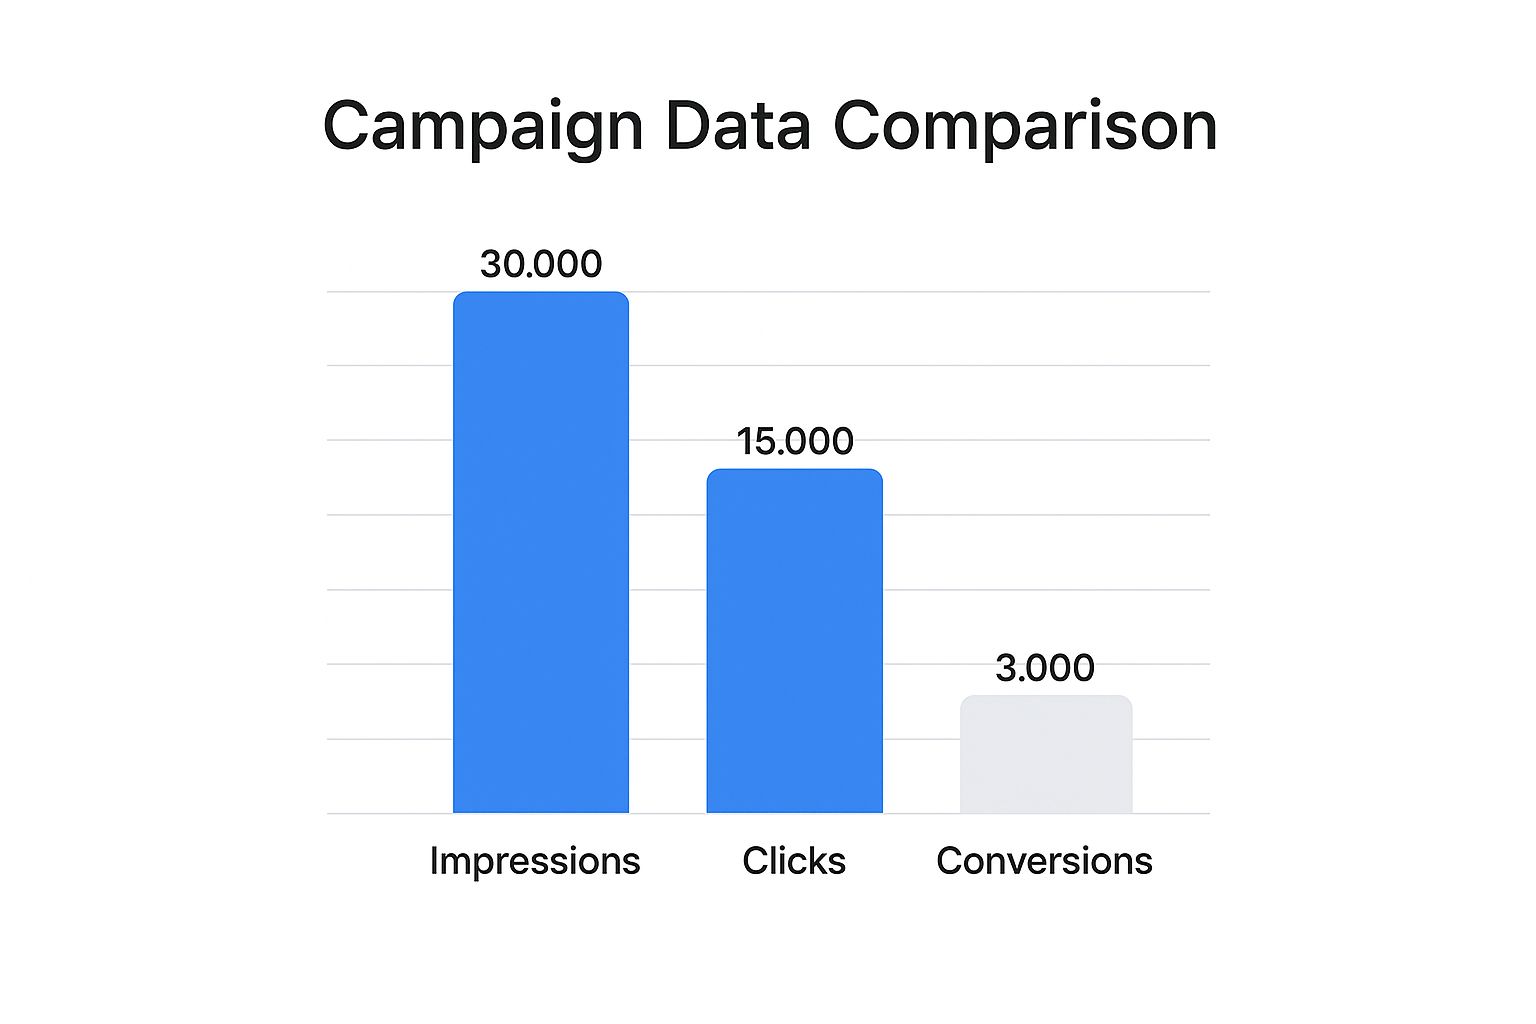
As you can see, a flood of impressions and clicks doesn't automatically lead to a high number of conversions. This is why you must track the entire customer journey, not just flashy vanity metrics. To learn more, discover what is a conversion in marketing in our detailed guide.
What advanced measurement techniques should you integrate?
Once you've mastered the basics, you can layer in more advanced methods for deeper insights. Techniques like media mix modeling (MMM) and brand lift studies help answer bigger-picture questions about how your marketing investments translate into business outcomes.
To help you choose the right approach, here's a quick comparison of common data collection methods.
A Comparison of Data Collection Methods
An effective measurement plan integrates performance metrics (like clicks and conversions) with consumer response and commercial data. This holistic approach helps you analyze incremental sales revenue and understand the true impact of your marketing spend.
Turning Data Into Actionable Campaign Insights

Raw data is just a pile of numbers. The real magic happens when you turn that data into a story—a story that tells you exactly what to do next. This is where analysis becomes your strategic advantage.
Simply collecting metrics is table stakes. You have to connect the dots between clicks, conversions, and your business goals.
It starts by looking past surface-level vanity metrics. A high click-through rate feels good, but did those clicks turn into sales? Proper data analysis helps you answer the tough questions and uncover the true narrative of your campaign’s performance.
How do you calculate your true return on investment?
One of the most essential measures is your Return on Investment (ROI). It’s the clearest way to connect campaign spending to revenue. But getting an accurate ROI calculation requires more than simple math, especially at scale.
For example, if you operate in different regions, you must assess leads and sales relative to the ad spend in each market. A "global" campaign isn't a single entity; you need to break down its profitability by country to see which markets are pulling their weight. Combining financial data with behavioral signals like local web traffic provides a much richer picture.
To dig deeper into measuring success across borders, check out this excellent piece on how to optimize strategies on marketermagazine.co.
A true ROI calculation tells you more than just "if" a campaign was profitable. It tells you where it was most profitable, allowing you to reallocate your budget for maximum impact.
This level of detail moves you from a simple pass/fail grade to a sophisticated understanding of your market.
How can mapping the conversion funnel find leaks?
Think of your conversion funnel as a customer’s journey from awareness to purchase. Analyzing this path is like being a detective; you’re looking for clues that show you where things are working and, more importantly, where they’re breaking down.
So, where are you losing people?
- High Bounce Rate on Landing Page: This often signals a mismatch between your ad copy and the page's content.
- Low "Add to Cart" Rate: Your product descriptions might not be compelling, or the pricing could be unclear.
- High Cart Abandonment: Complicated checkouts or surprise shipping costs are the usual suspects here.
By visualizing the entire funnel, you can pinpoint the exact drop-off points. If you discover that 80% of users abandon their cart when they see shipping costs, you know exactly what problem to solve first.
How can you uncover opportunities through segmentation?
The real power of data analysis lies in segmentation. Instead of viewing your audience as one giant group, slice your data into smaller, meaningful segments. This is how you find your most valuable customers.
Try breaking down your performance by:
- Channel: Which platform—Google Ads, Facebook, email—is bringing in the most valuable customers?
- Audience Demographics: How do different age groups, locations, or genders interact with your campaign?
- Device: Are your mobile users converting as well as desktop users? If not, you need to find out why.
Here’s a real-world scenario: An e-commerce brand saw that their overall campaign ROI was just okay. But when they segmented their data, a completely different story emerged.
While their main ad campaign was underperforming with younger audiences, one specific segment—women aged 45-60 on Instagram—had a 300% higher conversion rate and a much higher average order value.
This one insight was a game-changer. They shifted their budget to focus squarely on this high-value group. The result? Their overall campaign ROI doubled in a single month. That’s the power of turning data into decisive action.
Using Your Insights to Optimize Future Campaigns
The true value of measurement isn’t just looking back. It’s about turning knowledge into a cycle of continuous improvement. Every data point, good or bad, is a lesson you can use to make the next campaign smarter and more effective.
This is where you graduate from simply tracking performance to actively steering it. Your analysis becomes the fuel for every strategic decision, ensuring your marketing evolves.
How can you turn insights into effective A/B tests?
One of the most powerful ways to use your data is by building a structured A/B testing framework. As you analyze performance, you’ll naturally find areas of uncertainty—and those are perfect candidates for a test.
Let’s say you noticed a landing page has a high bounce rate. Your insight might be that the headline is disconnected from the ad that brought people there. This gives you a clear hypothesis to test:
- Control (A): The original, underperforming headline.
- Variant (B): A new headline that directly mirrors the promise in your ad copy.
This isn't guesswork; it's making calculated bets based on hard evidence. You can apply this same thinking to almost any part of your campaign:
- Ad Creative: Is that stock photo effective? Test it against a custom graphic or a short video.
- Call to Action (CTA): Pit "Shop Now" against "Explore the Collection." A simple word change can make a huge difference.
- Email Subject Lines: Try a direct subject line versus one that’s more mysterious to see what drives more opens.
The goal here isn't to find one massive win overnight. It's about making small, incremental improvements that compound over time. A series of data-backed wins can lead to a huge lift in overall performance.
How should you approach budget reallocation and scaling wins?
Your data is your best guide for where to put your money. If the numbers clearly show one channel is crushing another, it’s a bright, flashing sign telling you where to shift your resources.
Imagine you're running campaigns on both Google and Facebook. Your data reveals that while Facebook gets you clicks, your Customer Acquisition Cost (CAC) is 50% lower on Google, and the leads are far better. That insight gives you the confidence to move some of your Facebook budget to your best Google campaigns, instantly maximizing your ROI. Digging into Google Ads campaign optimization is a great next step.
The same logic applies when you find a winner. If a specific ad set is delivering amazing results, don't just leave it alone—scale it. Methodically increase the budget for your top performers while keeping a close eye on the metrics. To keep the momentum going, it's also worth learning about optimizing Facebook Ads for high ROI.
How do you build an effective feedback loop?
Finally, optimization doesn't happen in a vacuum. The insights you uncover are valuable for the entire organization. The key is to create a simple, consistent feedback loop to keep everyone informed.
This doesn't need to be complicated. A quick weekly email or a dedicated slide in your monthly report can clearly outline three things:
- Key Learnings: What did the data teach us this week?
- Actions Taken: Based on that, what changes did we make?
- Expected Outcomes: What do we expect to see from these tweaks?
This simple act demonstrates a proactive, strategic approach. It shows you aren't just launching campaigns and hoping for the best—you're at the helm, using data as your compass to navigate toward better results.
Frequently Asked Questions
Even veteran marketers face challenges when measuring campaigns. Here are answers to some of the most common questions to help you build confidence in your data.
How should a small business choose its marketing metrics?
If you’re running a lean operation, there’s no room for vanity stats. Focus on metrics that directly connect to revenue. In my experience, these three are non-negotiable:
- Customer Acquisition Cost (CAC): What is the actual cost to win one paying customer?
- Conversion Rate: Of all visitors, how many complete your desired action—buying, signing up, or contacting you?
- Return on Ad Spend (ROAS): For every $1 you put into ads, how much revenue do you get back?
In small-business measurement, simplicity wins. Track only the numbers that move your bottom line.
What if different platforms show conflicting data?
You’ll often see Google Analytics report one number while Meta Ads tells another story. Why? Each tool uses its own attribution model:
- Google Analytics often credits the last non-direct click.
- Meta Ads may claim credit for any view or click within a set window (e.g., a 7-day click or 1-day view).
The solution? Pick one system as your single source of truth—I typically recommend Google Analytics for its depth. Use other platform dashboards to refine audiences and creative, but stick to your primary tool for final reporting.
For a deeper dive, visit this guide to further frequently asked questions.
Ready to stop guessing and start converting? LanderMagic builds landing pages that adapt to every ad click, ensuring your post-click experience delivers results. Start optimizing your Google Ads campaigns today.