Summary
Meta Description: Unlock the true profitability of your campaigns. Learn how to calculate return on ad spend (ROAS) with our clear guide, featuring formulas, examples, and expert tips.
Before we dive into how to calculate your Return on Ad Spend, let's talk about why it's so critical. The formula itself is straightforward: Total Ad Revenue ÷ Total Ad Cost. But that simple ratio is the single clearest window you have into the direct profitability of your ad campaigns.
This isn't just another number to track; it’s the ultimate signal of what’s actually working and what's just burning through your budget. Ready to see if your ads are truly paying off?
Why ROAS Is Your Most Important Advertising Metric

In a world where every marketing dollar is under a microscope, knowing your Return on Ad Spend (ROAS) is non-negotiable. It cuts right through the noise of vanity metrics like clicks and impressions to answer the one question that truly matters: are my ads making money?
Think of it as the financial pulse of your advertising. For every single dollar you invest in a campaign, ROAS tells you exactly how many dollars you're getting back in pure revenue. That kind of clarity is a game-changer for businesses of all sizes, from scrappy startups to massive corporations.
Honestly, if you're not tracking ROAS, you're flying blind. Data-driven marketing isn't a buzzword anymore—it's the only way to stay competitive.
Understanding ROAS in the Broader Business Context
To truly appreciate why ROAS is so powerful for ad campaigns, it helps in understanding the broader concept of Return on Investment (ROI). While ROI gives you the 30,000-foot view of an entire business initiative's profitability, ROAS zooms in with laser precision on your ad campaigns alone.
This tight focus is what allows you to make smart, quick decisions. For example, you can:
- Spot your winners: Instantly see which campaigns are driving the most revenue so you can double down on what’s working.
- Cut your losses: Quickly identify underperforming ads that are draining your budget without delivering real results.
- Justify your budget: Go to stakeholders with hard, revenue-based numbers that prove the value of your advertising efforts.
The Growing Importance of Ad Spend Efficiency
The need for this kind of precise measurement has never been more critical. The global ad industry is on track to blow past $1.03 trillion for the first time, a staggering jump from the $384 billion spent back in 2011. With digital ads expected to make up over 75% of that spend, the competition is fierce.
In a market this massive, efficiency is everything. A high ROAS means you're not just spending money; you're investing it wisely to fuel real business growth.
Ultimately, ROAS is one of several crucial advertising performance metrics you need in your toolkit. It gives you the power to optimize campaigns, scale what works, and build a more profitable marketing machine from the ground up.
Diving Into the ROAS Formula with Real Numbers

On the surface, the ROAS formula looks incredibly simple: Revenue from Ads ÷ Cost of Ads. But to truly get a handle on your return, you have to dig deeper into what both sides of that equation actually represent. This is where the real insights are hiding.
"Revenue from Ads," for instance, isn't always a clean sales number. If you're running a lead generation campaign, that "revenue" is more of a projection based on the value of a new lead. And "Cost of Ads" is almost never just what you paid the ad platform. It needs to account for every single dollar that went into making that ad a success.
So many marketers trip up here. They only look at their direct ad spend, which gives them a wildly inflated—and totally misleading—ROAS figure.
What Are Your True Advertising Costs?
To get an honest ROAS, you have to add up every related expense. That means looking beyond the figure on your Google Ads dashboard and getting a complete picture of your investment. So, what should you include?
- Direct Ad Spend: This is the obvious one—the money you pay directly to platforms like Google, Meta, or LinkedIn.
- Agency or Freelancer Fees: If you're working with an agency or a freelancer to manage your campaigns, their fees are a direct cost of running those ads.
- Creative Production: Don't forget the costs for designing graphics, shooting and editing videos, or paying a copywriter.
- Software and Tools: Any subscriptions for analytics platforms, bidding software, or creative tools you use for your campaigns need to be factored in.
Ignoring these "hidden" costs is a classic mistake that can make a campaign look like a winner when it’s barely breaking even or, worse, losing money. A full cost breakdown gives you the real story.
Capturing every single expense is the foundation of honest campaign accounting. An accurate cost basis keeps you from making strategic moves based on bad data, giving you a crystal-clear view of your actual profitability.
An E-Commerce ROAS Example
Let’s bring this to life with a real-world scenario. Imagine you own an online shoe store and just launched a new Google Ads campaign.
- Total Revenue from Ad Campaign: You tracked $10,000 in direct sales from the campaign.
- Total Ad Cost: You spent $2,000 on Google Ads clicks, paid a freelance ad manager $500, and spent another $250 on new ad creative. Your total cost is actually $2,750.
Now, we just plug those numbers into the formula:
ROAS = $10,000 ÷ $2,750 = 3.64
What this tells you is that for every $1 you put into the campaign, you got $3.64 back. You'll often see this expressed as a 3.64:1 ratio.
A B2B Lead Generation ROAS Example
Things get a little more complex when you're a B2B SaaS company. A "conversion" here isn't a direct sale—it's usually a demo request or a whitepaper download. The trick is to assign a realistic monetary value to that lead.
Let's say your data shows that 1 out of every 10 demo requests turns into a paying customer, and your average customer lifetime value (LTV) is $5,000. That means each demo request is worth about $500 to your business ($5,000 ÷ 10).
- Revenue (Lead Value): Your campaign brought in 20 demo requests. The total value generated is $10,000 (20 leads x $500/lead).
- Total Ad Cost: You spent $4,000 on LinkedIn Ads for this campaign.
The ROAS calculation is straightforward:
ROAS = $10,000 ÷ $4,000 = 2.5
Your ROAS here is 2.5:1. This metric is a close cousin to another important number: Cost Per Acquisition. To see how these figures fit together to paint a complete picture of your campaign health, check out our guide on how to calculate cost per acquisition.
What Is a Good ROAS and How Do Benchmarks Vary?
Everyone asks for the magic number, the one "good" ROAS that guarantees success. But honestly? It's not that simple. There's no one-size-fits-all answer. Your ideal Return on Ad Spend depends entirely on your business model, profit margins, and the industry you're in.
While you'll often hear a 4:1 ratio—earning $4 for every $1 spent—tossed around as a solid benchmark, it's just a general guideline. For a business with healthy margins, a 4:1 ROAS is fantastic. But for another company with razor-thin margins, that same 4:1 might barely cover costs.
The real goal isn't to chase some generic industry number. It's to figure out what profitability looks like for you.
Finding Your Profitability Threshold
First things first, you need to look inward at your own numbers. Two metrics are absolutely critical here: your profit margins and your Customer Lifetime Value (LTV). A SaaS company selling high-margin software can thrive on a lower ROAS because each sale brings in significant profit. On the flip side, an e-commerce store with a high Cost of Goods Sold (COGS) needs a much higher ROAS just to stay afloat.
Your break-even ROAS is the absolute floor—the minimum you need to hit to not lose money. Anything above that number is pure profit. Knowing this figure shifts your focus from chasing industry averages to building a campaign that’s truly healthy for your specific business.
Think about it this way: a company with a juicy 50% profit margin only needs a 2:1 ROAS to break even. But a business operating on a tighter 20% margin needs to hit a 5:1 ROAS just to cover its expenses. See how different the definition of "good" can be?
Comparing ROAS Benchmarks Across Industries
While your own margins should be your north star, it’s still smart to see how you stack up against the competition. Industry benchmarks for ROAS can vary wildly, but that general 4:1 target is often seen as a solid goal to aim for.
Of course, the averages differ depending on the market. For instance, you might see automotive campaigns hovering around a 1.93 ROAS, while beauty and personal care hits about 3.01. The clothing and jewelry space often leads the pack with an average ROAS of 3.92. It's worth exploring these performance targets to get a feel for how ROAS differs across various markets.
This infographic breaks down what a typical ROAS benchmark might look like for a few different business models.
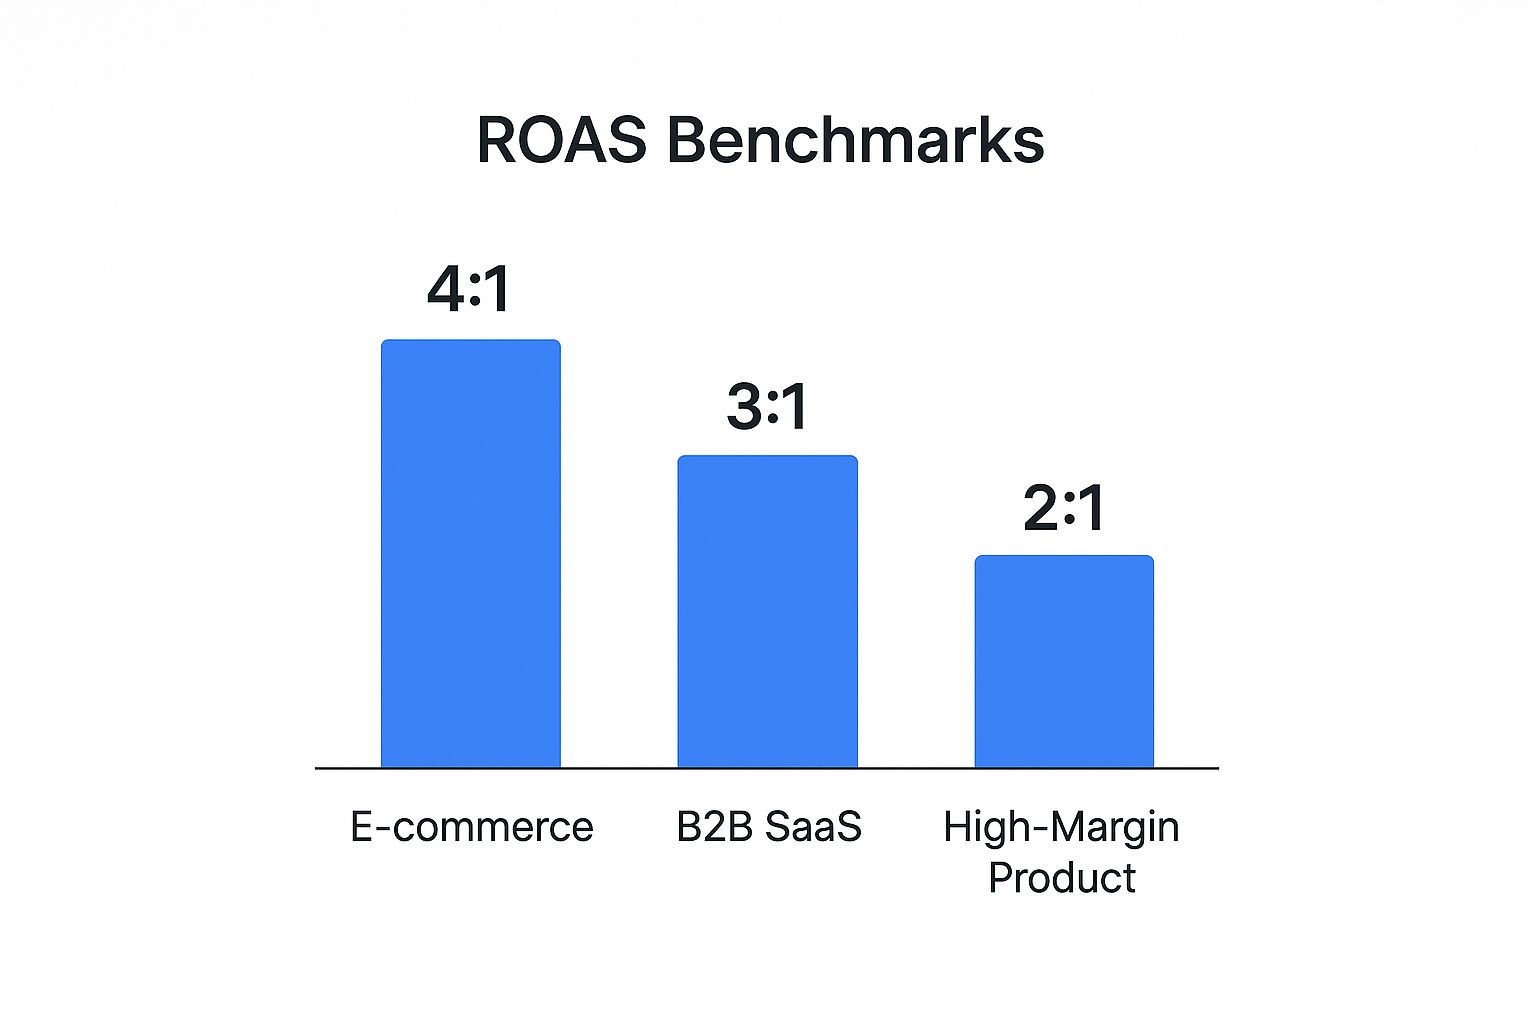
As the chart illustrates, a high-volume, low-margin e-commerce store naturally needs a higher ROAS to stay profitable. In contrast, a business selling high-margin products can do just fine with a lower ratio, since each conversion is so much more valuable.
Common Pitfalls in ROAS Calculation and How to Avoid Them
Calculating Return on Ad Spend seems simple on the surface, but it's dangerously easy to get it wrong. A few common mistakes can give you a completely skewed view of your campaign performance, leading you to make bad calls based on faulty data. The good news? These pitfalls are easy to sidestep once you know what you’re looking for.
One of the biggest blunders is looking only at the direct ad spend. Marketers often forget to factor in all the associated costs that go into a campaign, which artificially pumps up their ROAS. This creates a false sense of security, making a so-so campaign look like a massive success when it might be barely breaking even.
Think about it: your real investment is much more than just what you pay Google or Meta. To get an honest number, you have to be meticulous.
Ignoring Your True Campaign Costs
Your total ad cost is the sum of every single dollar spent to get that campaign live and running. Anything less is an incomplete picture. So, what gets left out most often?
- Management Fees: Are you paying an agency, a consultant, or a freelancer? Their fees are a direct cost of your advertising efforts and absolutely have to be included.
- Creative Production: The money spent on graphic design, video editing, and copywriting is part of the investment. Don’t forget it.
- Software Subscriptions: Any analytics tools, landing page builders like LanderMagic, or bidding platforms are essential costs.
- Cost of Goods Sold (COGS): This is a huge one. A high ROAS means very little if your product costs leave no room for actual profit.
Including all of these gives you a true ROAS—a metric that reflects actual profitability, not just vanity revenue.
An accurate calculation of return on ad spend requires you to track every penny. Forgetting costs like agency fees or creative work doesn’t just inflate your numbers—it masks underlying performance issues that could be costing you real money.
Misunderstanding Customer Attribution
Another major hurdle is attribution. In a world where customers interact with your brand across multiple touchpoints—a social ad, then a Google search, then an email—how do you decide which one gets the credit for the sale? Relying solely on a last-click attribution model is a classic mistake.
This model gives 100% of the credit to the very last interaction a customer had before converting. It’s simple, sure, but it completely ignores all the other ads that influenced their journey. This can trick you into undervaluing top-of-funnel campaigns that are critical for building awareness in the first place.
To get a more holistic view, you need to explore different models that distribute credit more accurately across the entire customer journey.
Comparing Attribution Models for Accurate ROAS
Choosing the right attribution model is key to understanding which channels are really driving value. A last-click model tells a very limited story, so it's worth exploring other options that paint a fuller picture of the customer journey.
The model you choose directly impacts your ROAS calculation for each campaign. By moving beyond last-click, you ensure you don't prematurely cut budgets for channels that play a vital, though less direct, role in driving your revenue.
By avoiding these common calculation traps, you’ll move from simply measuring ROAS to truly understanding—and improving—it.
Using Analytics to Track and Improve Your ROAS
Calculating your Return on Ad Spend by hand is a great way to wrap your head around the basic formula. But let's be honest, you can't scale an advertising strategy from inside a spreadsheet.
To really get ahead, you need to shift from spot-checking your numbers to tracking them in real-time. This is where analytics platforms become your secret weapon, turning raw data into actionable insights.
Modern ad platforms like Google Ads and Meta have powerful tools baked right in. Tapping into them gives you an immediate, up-to-the-minute picture of how profitable your campaigns are. This isn't just about saving a few minutes; it's about making quicker, smarter decisions that directly fatten your bottom line.
Setting Up Automated ROAS Tracking
First things first, you have to get your conversion tracking dialed in. The ad platforms need to know exactly what a "conversion" means to your business. Is it a sale? A lead form submission? A phone call?
Once you’ve defined these critical actions, you need to assign a monetary value to them.
For an e-commerce store, this part is pretty straightforward. The platform can just pull the actual sale price from each transaction. But for lead generation, you'll have to assign a value—either static or dynamic—to each lead you capture, just like we talked about earlier.
With conversion values in place, you can add ROAS as a primary column in your ad platform's dashboard. It’s a simple tweak, but it completely transforms your reporting from a boring list of clicks and costs into a crystal-clear profitability analysis.
Interpreting Your Analytics Dashboard
Just seeing a ROAS number on your screen is one thing. Actually understanding the story it’s telling you is something else entirely. Your analytics dashboard is a goldmine of insights, but you have to be willing to dig.
Don't just glance at the campaign-level ROAS and call it a day. Go deeper.
Start asking the right questions:
- Which keywords or ad groups are driving the highest ROAS? This tells you exactly where you should be doubling down on your budget.
- Which audiences are the most profitable? Use this to sharpen your targeting or build powerful lookalike audiences.
- Are certain ad creatives blowing others out of the water? This is your guide for all future creative work.
- Does ROAS fluctuate by device or time of day? This is your cue to set up bid adjustments and optimize your ad schedule.
Think of your analytics platform as a diagnostic tool, not just a calculator. It’s there to help you pinpoint exactly what’s working and what's just burning cash. A disappointing overall ROAS could easily be hiding a few hyper-profitable micro-campaigns that are just waiting to be scaled up.
Taking Action to Improve ROAS
Once you have these insights, you can shift from just watching the numbers to actively optimizing your campaigns. The game has changed. With digital advertising now commanding 72.7% of global ad investment, the ability to act on data is non-negotiable.
As ad spending balloons into a trillion-dollar industry, the smartest companies are the ones using analytics to make their ROAS calculations both precise and actionable.
One of the most effective ways to do this is by connecting your ad accounts to your CRM. This creates a seamless flow of information that reveals the true, long-term value of your campaigns. If you want to go deeper, check out how automating lead generation to maximize ROAS can completely reshape your strategy.
Tracking ROAS is a huge piece of the puzzle, but it's still just one piece. To see how it fits into the bigger picture, take a look at our full guide on how to measure marketing campaign success. When you start connecting all the data points, you build a powerful, data-driven engine for sustainable growth.
Frequently Asked Questions About ROAS
Once you start digging into ROAS, a few common questions always seem to surface. It’s one thing to know the formula, but it’s another to apply it confidently in the real world. Let's tackle some of the most frequent ones I hear from other marketers.
ROAS vs. ROI: What's the Real Difference?
This is easily the most common point of confusion, but the distinction is crucial for understanding your business health.
Think of ROAS (Return on Ad Spend) as your campaign's pulse check. It's a laser-focused metric telling you one thing: for every dollar you put into a specific ad campaign, how much gross revenue did you get back? It’s all about the immediate effectiveness of your ads.
ROI (Return on Investment), on the other hand, is the big-picture metric. It looks at the total profitability of an investment after you subtract all the associated costs—not just ad spend, but also the cost of goods, shipping, software, and everything else.
In short: ROAS measures ad efficiency, while ROI measures overall business profitability. You need both to get a complete picture.
How Often Should I Be Checking My ROAS?
There’s no magic number here—it really boils down to your sales cycle and the pace of your campaigns.
If you’re in the fast-paced world of e-commerce, sales happen in minutes or hours. In that case, checking ROAS daily or weekly is smart. It gives you the real-time feedback needed to tweak bids, kill underperforming ads, and double down on what’s working.
But for a B2B company with a six-month sales cycle, daily checks would be pointless and probably misleading. A monthly or even quarterly review makes much more sense, giving you a stable, reliable view of how your ads are contributing to the pipeline over the long haul.
Is It Possible to Have a Good ROAS and Still Lose Money?
Absolutely, and it's a dangerous trap. This is where a lot of marketers get tripped up, especially if they're not keeping a close eye on their profit margins.
Imagine your campaign hits a 2:1 ROAS. You’re making $2 in revenue for every $1 spent on ads. Sounds pretty good, right?
But what if your total cost of goods sold (COGS), shipping, and other operational expenses eat up more than 50% of your revenue? In that scenario, you're actually losing money on every single sale your "successful" ad campaign generates. This is exactly why you can't just look at ROAS in a vacuum.
What’s My Break-Even ROAS?
Your break-even ROAS is the magic number you need to hit just to cover your costs. It’s the point where you haven’t made any profit, but you also haven’t lost any money from your ad spend. Anything above this number is profit.
Calculating it is surprisingly simple once you know your profit margin.
The formula is: 1 ÷ Your Profit Margin.
So, if your business has a profit margin of 25% (or 0.25), your break-even ROAS is 1 / 0.25 = 4. That means you need a 4:1 ROAS at a minimum just to break even on your ad spend.
Knowing this number turns ROAS from a vanity metric into a powerful tool for making profitable decisions.
Ready to move beyond basic tracking and create landing pages that supercharge your ROAS? LanderMagic uses AI to build dynamic, high-converting pages tailored to every ad click, ensuring your ad spend delivers maximum returns. Discover how LanderMagic can transform your post-click experience today!