Summary
Meta Description: Master your campaigns with our guide to key digital advertising performance metrics. Learn to track, analyze, and optimize for better ROI and ROAS.
Digital advertising metrics are the numbers that tell you if your ads are actually doing their job. They cut through the noise, translating your ad spend into a clear story of what’s clicking with your audience and what’s falling flat.
Think of them as the vital signs for your campaigns. Are you ready to take control?
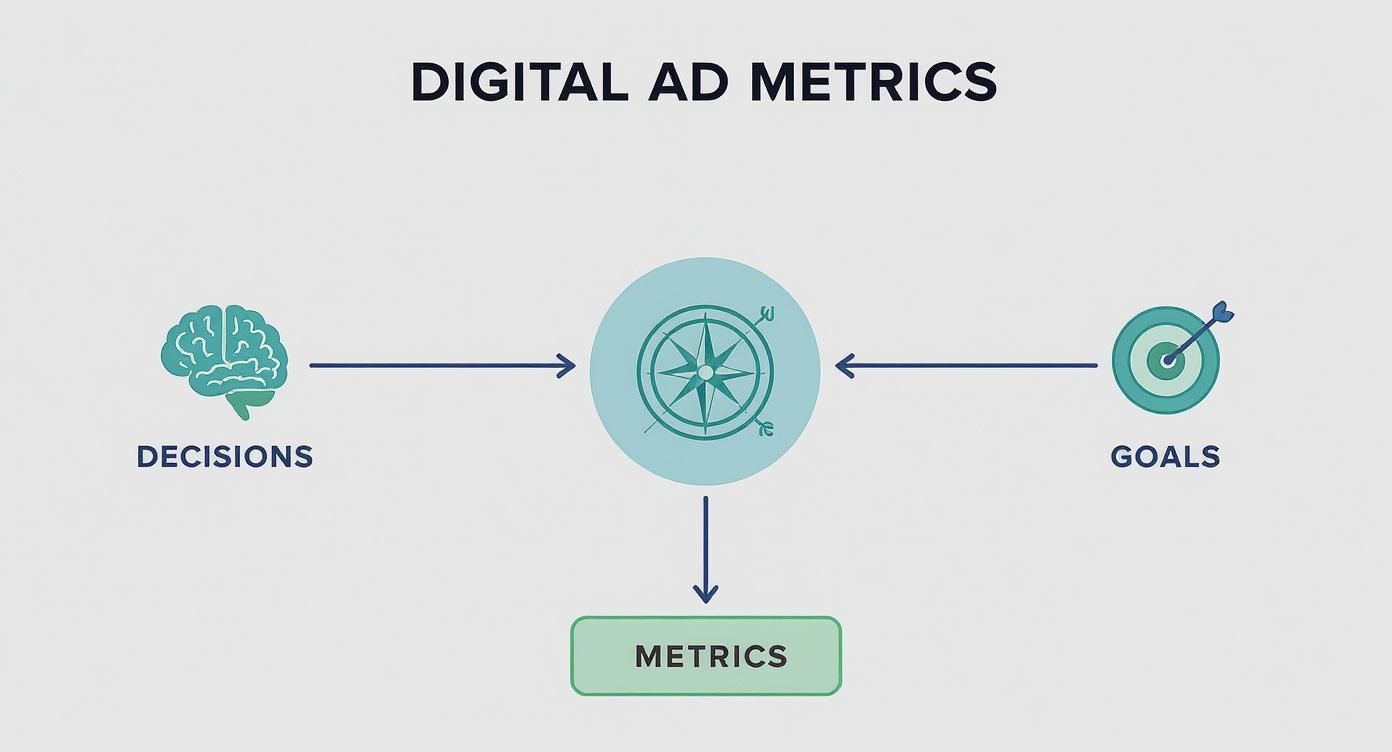
Why Metrics Are Your Campaign's Compass
Running an ad campaign without tracking metrics is like flying a plane with no instruments. You’re burning fuel and you know you’re moving, but do you have any idea if you're heading in the right direction, gaining altitude, or about to nosedive?
Without data, you're just guessing. In advertising, guessing is an expensive hobby.
Each metric is a gauge on your dashboard. Impressions tell you you've taken off. Click-Through Rate (CTR) shows if you’re on the right flight path. These numbers provide the real-time feedback you need to steer your campaigns toward your ultimate destination: profitability.
From Spending to Strategizing
Not too long ago, advertising success was a fuzzy concept, hard to pin down with real numbers. Today, it’s a different world. Every click, view, and sale can be tracked, turning marketing from a shot in the dark into a data-driven science. If you want to prove your marketing is working and hit your business goals, getting a handle on these metrics is non-negotiable.
This data-first mindset is reshaping the entire industry. By 2025, digital advertising is expected to account for 75.2% of all global ad spending, hitting a staggering $777 billion. Why the massive shift? Because digital offers what traditional ads couldn't: efficiency and measurable results.
The Foundation of Smart Decisions
When you understand your performance metrics, you can finally answer mission-critical questions about your campaigns:
- Is my message resonating? If engagement is low, it’s a clear sign your ad copy or visuals need a rethink.
- Am I reaching the right people? Getting tons of impressions but hardly any clicks? Your targeting might be way too broad.
- Is my ad spend actually making me money? Metrics like ROAS (Return on Ad Spend) draw a straight line from your budget to your bottom line.
By learning to read this data, you stop spending money blindly and start investing it strategically. You gain the power to diagnose problems, identify opportunities, and make adjustments that lead to better results and a healthier ROI.
For a deeper dive into understanding online advertising performance metrics that drive real growth, this resource is a goldmine. It’s all about making every dollar count by knowing exactly what it’s doing for you.
What Are the Essential Metrics Every Marketer Must Track?
To succeed with digital advertising, you have to speak the language. That language is data, and the words are your performance metrics. Let’s break them down into groups that tell a story about your campaigns and, more importantly, your audience.
We’ll organize these key metrics into three buckets that follow the customer journey: Awareness, Engagement, and Cost Efficiency. Each one answers a critical question about how your ads are performing.
Think of it like this: these metrics are the dashboard of your campaign. They show you what's working, what's broken, and where you're headed.
As you can see, none of these numbers live on an island. They’re all connected, and together they paint a complete picture of your campaign’s health.
Awareness Metrics: Are You Being Seen?
Before anyone can click, buy, or sign up, they have to see your ad. It's that simple. Awareness metrics tell you how much ground you're covering and how many eyeballs are on your campaign.
- Impressions: This is the raw count of how many times your ad was shown on a screen. High impressions mean your ad is getting out there, but it doesn’t tell you if the right people are seeing it.
- Reach: This number is different. It counts the unique people who saw your ad at least once. Reach is about the size of your audience, while impressions are about frequency.
These two work as a team. If you have tons of impressions but low reach, you might be hammering the same small group with your ad. That's a classic sign of ad fatigue and a signal to switch up your creative.
Engagement Metrics: Is Your Message Resonating?
So people are seeing your ad. The next big question is: do they care? Engagement metrics are all about action. They measure how your audience interacts with your ads and give you a direct pulse on how compelling your creative and copy truly are.
Strong engagement is the bridge between visibility and conversion. It’s the proof that your creative is not just being seen but is actively compelling people to take the next step.
Here are the bread-and-butter engagement metrics:
- Clicks: The total number of times someone actually clicked on your ad. A click is a clear sign of interest—it means your ad made someone want to learn more.
- Click-Through Rate (CTR): This is the percentage of people who clicked your ad after seeing it. You calculate it by dividing total clicks by total impressions. CTR is a fantastic indicator of your ad's relevance. A low CTR is a red flag.
The interplay here is what matters. As advertising costs climb, a strong CTR and conversion rate separate the winners from the losers. By 2025, an estimated 65% of industries are seeing improved conversion rates, proving that smart advertising is far more valuable than just chasing cheap clicks.
Cost Efficiency Metrics: Are You Spending Wisely?
Finally, we get to the bottom line. Is your campaign making financial sense? Cost efficiency metrics tie your ad performance directly to your budget, helping you understand what you're paying for every view, click, and customer.
- Cost Per Click (CPC): This is simply the amount you pay for each click on your ad. It’s a go-to metric for managing your budget and driving traffic.
- Cost Per Mille (CPM): Also known as Cost Per Thousand Impressions, CPM is the price you pay for 1,000 ad views. If your goal is brand awareness, CPM is the metric you’ll watch closely.
- Cost Per Acquisition (CPA): This is the big one for many businesses. CPA measures the total cost to get one customer or conversion. Before you can optimize it, you must know your numbers, so check out our guide on how to calculate Cost Per Acquisition to get started.
To make it even clearer, here’s a quick cheat sheet to help you focus on the right metrics for your campaign goals.
Key Digital Advertising Metrics at a Glance
This table breaks down the essential metrics, what they measure, and when they matter most.
By looking at these groups of metrics together, you stop just collecting numbers and start building a story about your campaign. You can diagnose problems, find opportunities, and make sharp decisions that drive growth.
Connecting Ad Spend to Real Profit with ROAS and ROI
Impressions and clicks are nice, but they don't pay the bills. When it's time to show the real value of your campaigns, stakeholders want to see one thing: how your ad spend is turning into profit. This is where the most critical digital advertising performance metrics really shine.
It's time to dig into the two metrics that directly measure profitability: Return on Ad Spend (ROAS) and Return on Investment (ROI). They might sound similar, but they tell two very different stories.

Getting this distinction right is crucial for having meaningful conversations about your marketing's bottom-line impact.
What Is Return on Ad Spend (ROAS)?
Think of ROAS as a magnifying glass zoomed in on a single ad campaign. It answers one simple question: for every dollar you put into this campaign, how many dollars in revenue did you get back?
It’s a straightforward metric that isolates the effectiveness of your advertising.
ROAS is the pulse-check for your ad campaigns' immediate financial performance. It gives you a clear, quick measure of whether an ad is generating more revenue than it costs to run.
The formula is simple:
ROAS = Total Revenue from Ad Campaign / Total Cost of Ad Campaign
A ROAS of 4:1 means you generated $4 in revenue for every $1 you spent. Naturally, the higher, the better.
What Is Return on Investment (ROI)?
If ROAS is the magnifying glass, ROI is the wide-angle lens. It pulls back to see the bigger picture, looking beyond just ad costs to consider the overall profitability of your entire marketing investment.
ROI accounts for everything, including:
- Cost of goods sold (COGS)
- Software and tool subscriptions
- Shipping and handling fees
- Team salaries or agency fees
ROI answers the ultimate business question: after subtracting all expenses, did this investment actually make the business money?
The formula tells the whole story:
ROI = (Net Profit / Total Investment Cost) x 100
Because ROI focuses on net profit, not just revenue, it gives you a true measure of your campaign's contribution to the company's bottom line.
Why a Good ROAS Does Not Guarantee Profit
This is a classic trap. You can have a fantastic ROAS and still be losing money. How is that possible?
Let's walk through an example. Imagine you run an e-commerce store.
- You spend $1,000 on a Google Ads campaign.
- That campaign brings in $4,000 in sales.
Your ROAS is a stellar 4:1. On paper, you're crushing it!
But let's factor in other costs. The products themselves cost $2,500 to produce (your COGS). Your total investment is now $1,000 + $2,500 = $3,500.
Now, let's calculate your actual ROI. Your net profit is just $500 ($4,000 revenue - $3,500 total costs). So your ROI is ($500 / $3,500) x 100 = 14.3%. It's positive, but it paints a much more sober picture. You made a profit, but the margins are tight.
For a detailed look at the financial performance of different advertising channels, check out this comparison of Amazon PPC Marketing vs Influencer ROI.
Understanding this difference is key. If you want to dive deeper, learn more about the critical differences in our detailed guide on ROI vs. ROAS. By tracking both, you get the complete story—the efficiency of your ads and their actual contribution to business growth.
How to Turn Raw Data into Actionable Insights
A spreadsheet packed with digital advertising performance metrics is just noise. The magic happens when you turn that raw data into a strategic advantage—when you start connecting the dots to see what’s really going on.
This is what separates the marketers who react from the ones who strategize. Instead of getting lost in individual numbers, you start asking bigger questions. What story are these metrics telling me?
From High Clicks to Low Conversions: What's the Story?
Let's walk through a real-world example. Imagine your new ad campaign is pulling in a CTR of 8%, way above average. Clearly, people love the ad.
But sales are a total letdown. The landing page is only converting at 0.5%. What went wrong? The high CTR confirms your ad creative and targeting are on point. The problem isn’t getting people to click; it’s what’s happening after the click.
By tracing the user's journey, you find the bottleneck. The ad proudly promises a "50% Off Flash Sale," but the landing page is just your generic homepage. Visitors land, get confused, can't find the deal, and bounce. The ad wrote a check that the landing page couldn't cash.
Your advertising data doesn’t just live in your ad platform. It tells a story that extends across the entire customer journey. A disconnect at any point can break the chain.
Looking for Trends, Not Just Daily Blips
Another key to finding real insights is learning to analyze performance over time. It’s easy to get caught up in daily swings, but reacting to every little blip is a recipe for chaos.
The true insights are hiding in the trends. Are costs slowly creeping up month after month? Is CTR consistently tanking on weekends? Zooming out helps you spot these larger patterns, letting you make smart, strategic adjustments.
To start uncovering these trends, get into the habit of:
- Weekly Performance Reviews: Keep an eye on metrics like CPA and ROAS on a week-over-week basis. This helps you spot issues before they become problems.
- Month-Over-Month Analysis: Compare this month's performance to last month's to get a feel for your campaign’s overall momentum.
- Year-Over-Year Comparisons: This is a must for seasonal businesses. It’s the only way to know if you're actually growing.
Segmenting Your Data for Deeper Understanding
Not all clicks are created equal. The most valuable insights are often buried in specific segments of your audience. Lumping all your data into one big pile can easily mask both golden opportunities and serious problems.
By segmenting your data, you can start asking more powerful questions.
- By Device: Are your mobile users converting at a lower rate than desktop users? That’s a massive red flag pointing to a clunky mobile landing page.
- By Audience: Which specific demographic is driving the highest ROAS? Now you know exactly where to double down with your budget.
- By Location: Are certain cities showing unusually high engagement? That could be your cue to launch a geographically targeted campaign.
Segmenting your digital advertising performance metrics is like switching from a telescope to a microscope. It lets you move past the big picture and see the individual components driving your success.
How to Optimize Campaigns Using Your Performance Data
So you have the numbers. That's the easy part. The real magic happens when you turn that raw data into action. It's time to roll up your sleeves and make some changes. This is where you shift from watching the game to actively playing it, turning insights into campaign improvements that move the needle.
Think of it as a feedback loop. Your data points to a problem, and your optimizations are how you respond.

Responding to a High Cost Per Acquisition (CPA)
One of the most common headaches is a rising Cost Per Acquisition (CPA). When it costs more to land a customer, your profits evaporate. Your data is practically screaming that something's inefficient. So, what's the play?
A high CPA often boils down to two main culprits: you're either talking to the wrong people, or your offer falls flat on your landing page.
- Refine Your Audience Targeting: Jump back into your ad platform and tighten your focus. Are your interest targets too broad? Start excluding audiences that aren't engaging to stop wasting money.
- A/B Test Your Landing Page: A bad landing page is a conversion black hole. Your ad makes a promise, and your page must deliver—instantly. This is where a tool like LanderMagic becomes your secret weapon.
A high CPA isn't a report card—it's a road map. It’s your data telling you precisely where to look for leaks, often pointing straight to a disconnect between your ad and your landing page.
By methodically testing different headlines and calls to action (CTAs) on your LanderMagic pages, you can dial in the perfect combination that brings your CPA down.
Tackling a Low Click-Through Rate (CTR)
What if people are seeing your ads but just scrolling on by? A dismal Click-Through Rate (CTR) is a clear sign your creative or messaging isn't cutting through the noise.
This problem is all about relevance and appeal. Your job is to create ads that are impossible for your ideal customer to ignore.
Here are a few proven tactics to try:
- Rewrite Your Headlines: Your headline does 80% of the heavy lifting. Test a direct, benefit-packed headline against a more curious one. Make the value obvious.
- Refresh Your Creative: Ad fatigue is real. If someone has seen the same image 20 times, their brain has learned to ignore it. Swap in new visuals and test static images against short video clips.
- Strengthen Your Call to Action: Ditch "Learn More." Get specific and create urgency with "Get Your Free Quote" or "Download the Guide Now." A powerful CTA gives people a clear next step.
Each of these changes is just a hypothesis until you test it. Let the data pick the winner. If you're running Google Ads, our guide has even more tips on Google Ads campaign optimization to help you squeeze more value from every dollar.
Boosting Conversion Rate and ROAS with LanderMagic
At the end of the day, it's all about improving your core money metrics: Conversion Rate and Return on Ad Spend (ROAS). While tweaking your ads is a good start, the biggest wins almost always come from perfecting what happens after the click.
This is where LanderMagic truly shines. Its intuitive, AI-powered platform lets you quickly make the changes your data is begging for.
Let's say your analytics show a high bounce rate from mobile users. With LanderMagic, you can build a mobile-first landing page variant in minutes, complete with a cleaner layout and thumb-friendly buttons. Send your mobile traffic there and watch your conversion rates climb.
Ready to stop guessing and start building? Take full control of your post-click experience. Sign up for LanderMagic today and start turning your data insights into real-world results.
Your Top Advertising Metrics Questions, Answered
Jumping into the world of digital advertising always sparks a few questions. This last section is all about tackling those common questions with clear, straightforward answers to help you run your campaigns with more confidence.
Think of it as your go-to cheat sheet for clearing up any lingering doubts.
What Is a Good Benchmark for My Metrics?
This is easily the most common question, but the honest answer is: it depends. A "good" Click-Through Rate (CTR) or Cost Per Acquisition (CPA) can swing wildly depending on your industry, target audience, platform, and campaign goal.
For instance, a 2% CTR might be average for Google Search ads but phenomenal for display ads.
Instead of chasing a universal magic number, you should focus on two things:
- Your Own Historical Data: Your most important benchmark is your own past performance. The goal is continuous improvement—always trying to beat last month's numbers.
- Industry-Specific Reports: Keep an eye out for annual reports from sources like WordStream or Statista. Just use these as a general guide, not a strict rulebook.
How Often Should I Check My Campaign Data?
This is a classic dilemma. Check too often, and you’ll make impulsive decisions. But wait too long, and you could burn your budget on a failing campaign. What is the right balance?
A healthy balance is everything. Fight the urge to hit refresh on your dashboard every hour. Instead, set up a consistent and strategic rhythm for checking in so you can spot trends that actually matter.
Here’s a practical schedule that works for most businesses:
- Daily Quick Checks (5-10 minutes): Glance at top-level numbers like ad spend, clicks, and conversions. The goal isn’t to make big moves, but to catch major red flags.
- Weekly Deep Dives (30-60 minutes): This is your time to analyze performance trends. How does this week compare to last? Use this session to plan your optimizations for the week ahead.
- Monthly Strategic Reviews: Now it's time to zoom out and look at the big picture. How did your campaigns support your broader business goals? This is when you make larger strategic calls about your budget and direction.
By getting into this rhythm, you stay on top of your campaigns without getting lost in the noise. It allows you to make smarter, data-backed optimizations that will actually improve your digital advertising performance metrics over the long run.
Ready to transform your post-click experience and turn more of your ad spend into profit? LanderMagic gives you the power to build, test, and optimize high-converting landing pages that your visitors will love. Stop letting a poor landing page kill your ROAS. Sign up for LanderMagic today and see the difference for yourself.